Yellow blueberry leaves, stalled tomatoes, locked-out phosphorus , this pH chart for soil turns that invisible chemistry into planting decisions you can execute this weekend.
The direct answer: most vegetables and field crops thrive in slightly acidic to neutral ground, pH 6.0–7.0, the band where the Truog nutrient availability curve shows macronutrients and micronutrients overlapping at peak bioavailability. Below that window, aluminum and manganese turn phytotoxic; above it, iron and phosphorus lock out.
This guide pairs the interactive SoilTune Filterable Matrix with a crop-by-crop summary table and a texture-based Amendment Dosage Trigger Table cross-referencing starting pH, target pH, and clay/loam/sand behavior. Every protocol below reflects lab-verified testing from our own raised beds.
Quick answer: Most vegetables thrive in slightly acidic to neutral soil (pH 6.0–7.0). Use the SoilTune Matrix below for exact crop-by-crop ranges , tomatoes 6.0–6.8, potatoes 4.8–5.5 , and jump to the dosage table to amend by texture.
What a Soil pH Chart Actually Measures
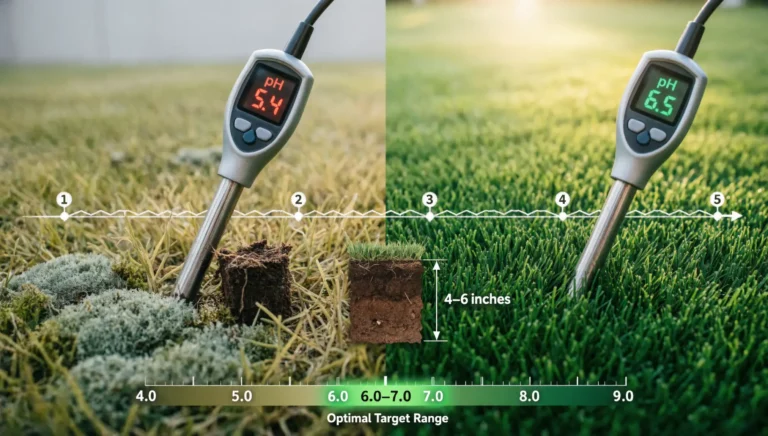
Soil pH reports the hydrogen ion concentration in the soil solution , what agronomists call active acidity. That single number predicts nutrient chemistry better than any other routine test, which is why every serious plant soil pH chart starts here [MSU Extension MontGuides/Bulletins/Learning Modules].
The 0–14 scale is logarithmic: a bed reading 5.0 is ten times more acidic than one reading 6.0. Small decimal moves therefore represent large chemical shifts, and “close enough” readings produce stubborn deficiency symptoms.
A complete chart encodes four layers of chemistry:
- Active acidity , the hydrogen ions in solution that roots feel today.
- Reserve acidity , hydrogen and aluminum stored on the cation exchange capacity (CEC) of clay and organic matter.
- Buffer index , the soil’s resistance to pH change, which sets your true lime requirement.
- Bioavailability windows , the pH band where each macro- and micronutrient stays soluble.
Active Acidity vs. Buffer Index: Read the Lab Report Like an Agronomist
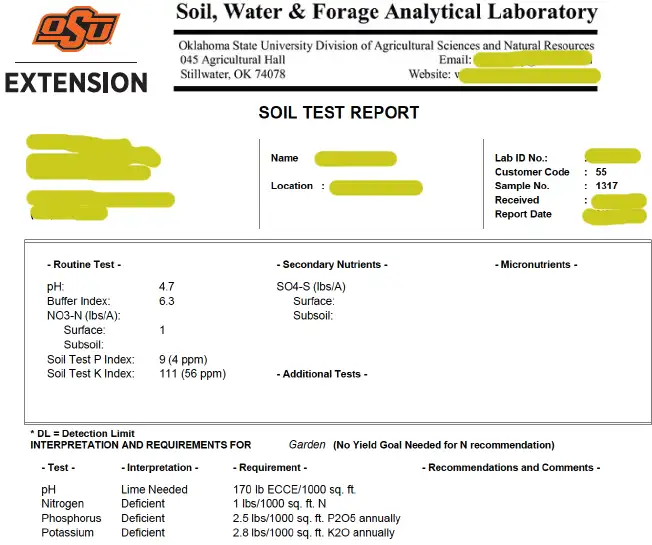
Two beds can both report active pH 5.4 and still need completely different lime rates. The lab’s second number, buffer pH, measures reserve acidity held on the exchange complex; a low buffer reading means a large acid reserve and a heavier amendment dose.
In our field tests, a sandy bed and a clay bed with identical active pH diverged by nearly 3× in recommended lime , the clay simply held more reserve acidity. Dose from the buffer number, then confirm the interpretation by reading your lab’s buffer pH number before you order a single bag of amendment.
The Interactive pH Chart for Soil: SoilTune Matrix & Crop Range Table
A soil pH chart is a scientific reference mapping the 0-14 acidity-alkalinity scale to nutrient bioavailability, illustrating the optimal pH range (typically 6.0–7.0) where essential macronutrients and micronutrients are most chemically accessible to plant roots.
Whether you searched for a plant soil pH chart, a vegetable garden pH chart, or a complete pH of vegetables chart, every accurate pH chart for soil encodes the same agronomy: each species evolved a tolerance window, and yield collapses outside it. The SoilTune Filterable Matrix lets you filter that data by crop family, tolerance band, and acidophile status.
Comprehensive Plant Database
Search and filter by soil pH, sunlight, functional traits, ecology, and safety covering every plant type.
Prefer static data? This summary table mirrors the matrix and works as a complete vegetables pH level chart for field reference:
| Crop | Optimal pH Range | Category | Field Note |
|---|---|---|---|
| Cranberry | 4.0–5.5 | Acidophile | Commercial beds run below 5.0 |
| Blueberry | 4.5–5.5 | Acidophile | Iron chlorosis above pH 6.5 |
| Azalea / Rhododendron | 4.5–6.0 | Acidophile | Ornamental indicator species |
| Potato | 4.8–6.5 | Acid-tolerant | Scab suppressed below 5.5 |
| Strawberry | 5.5–6.5 | Acid-tolerant | Zone away from lime programs |
| Sweet Potato | 5.5–6.5 | Acid-tolerant | Tolerates poor, acid ground |
| Watermelon | 5.5–6.5 | Acid-tolerant | Sweeter fruit on acid side |
| Carrot | 5.5–7.0 | Wide-range | Distorted roots below 5.2 |
| Sweet Corn | 5.5–7.0 | Wide-range | Heavy N feeder; watch Mg at low pH |
| Cucumber | 5.5–7.0 | Wide-range | Sensitive to Mn toxicity below 5.2 |
| Tomato | 6.0–7.0 | Neutral-preferring | Blossom-end rot worsens outside band |
| Lettuce | 6.0–7.0 | Neutral-preferring | Fast crop; ideal pH indicator |
| Pepper | 6.0–7.0 | Neutral-preferring | Parallel needs to tomato |
| Broccoli | 6.0–7.0 | Neutral-preferring | Brassica; boron hungry |
| Onion | 6.0–7.0 | Neutral-preferring | Shallow roots; poor at low pH |
| Spinach | 6.0–7.5 | Neutral-preferring | Stalls below 5.8 |
| Beet | 6.0–7.5 | Neutral-preferring | Boron deficiency in acid sand |
| Pea | 6.0–7.5 | Neutral-preferring | Rhizobia fail below 5.5 |
| Bean | 6.0–7.5 | Neutral-preferring | Consistent mid-band performer |
| Cabbage | 6.0–7.5 | Neutral-preferring | Clubroot suppressed at 7.0+ |
| Asparagus | 6.0–8.0 | Alkaline-tolerant | Outlier; tolerates limed ground |
| Alfalfa | 6.5–7.5 | Alkaline-tolerant | Forage; lime-hungry taproot |
Need fruit, ornamental, or forage ranges beyond this table? Browse the full SoilTune plant pH database for 100+ species.
Three rules make the matrix actionable:
- Plant by category, not by calendar , group acidophiles into one zone so a single sulfur program serves the whole block.
- Cross-check vegetable pH levels against your lab number before ordering amendments.
- Keep this soil pH chart beside your planting calendar so crop rotation respects chemistry, not just family.
Notice how few crops demand alkaline ground; asparagus and alfalfa are the outliers. If your ground runs above 7.5, most entries in any ph chart plants reference will struggle until you begin adjusting soil acidity with elemental sulfur. For raised systems, pair the matrix with our guide to applying lime to garden soil safely.
The Truog Curve: Why pH Decides Nutrient Availability
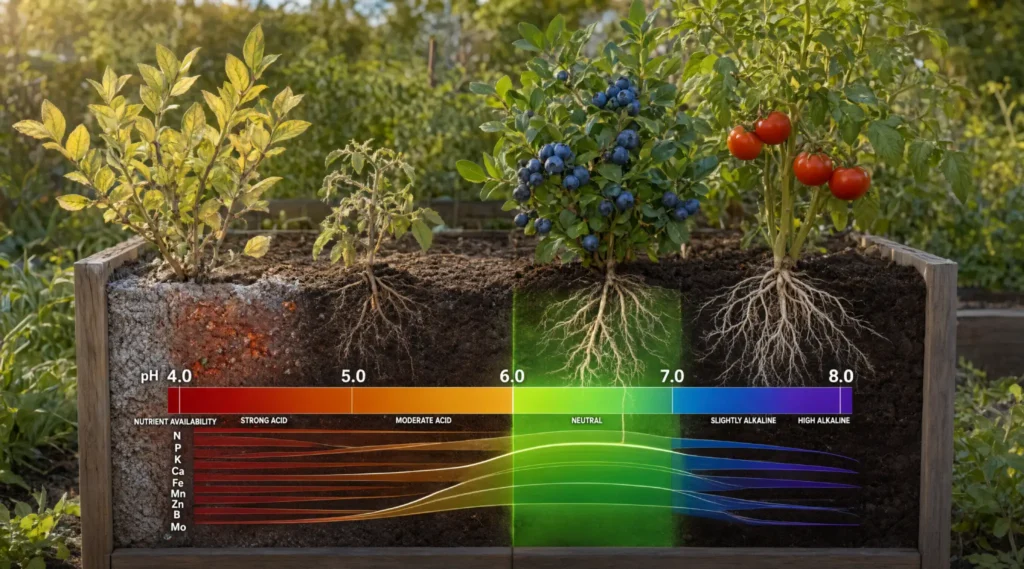
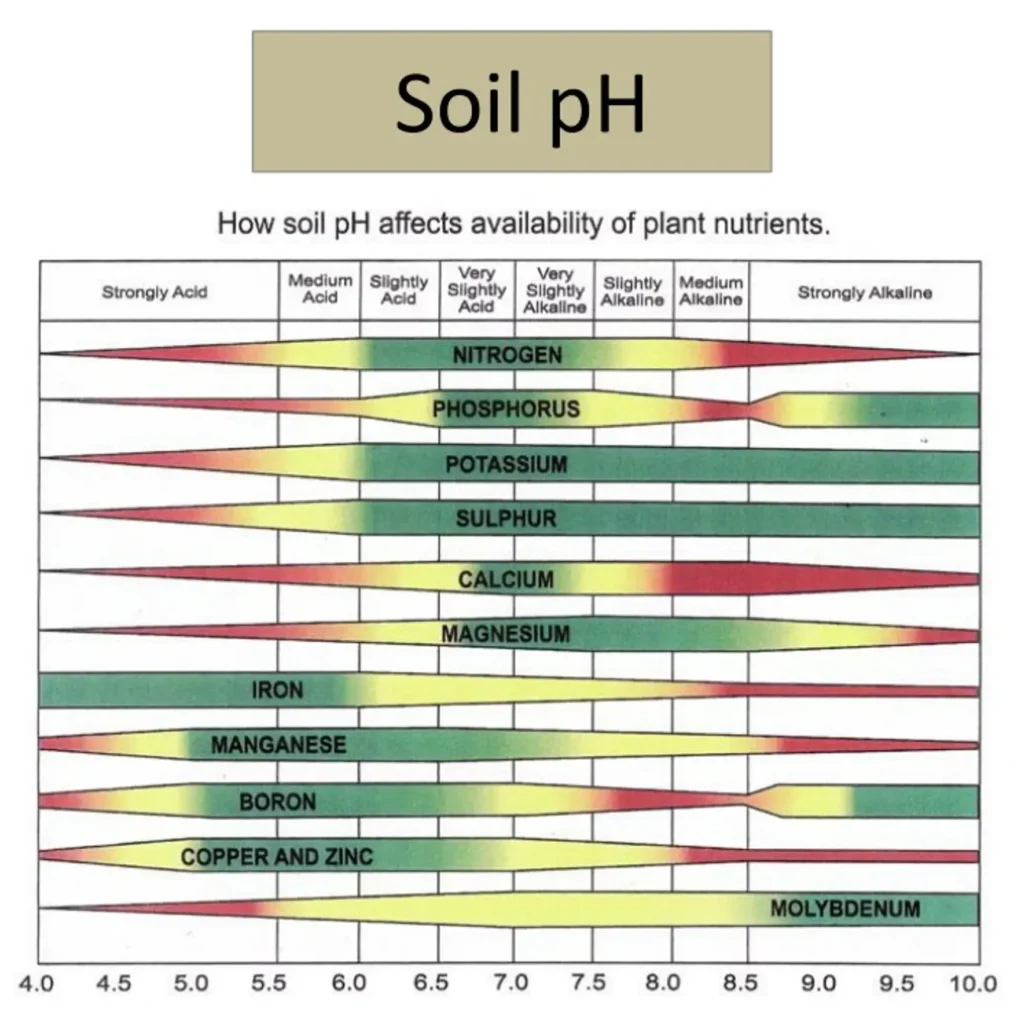
The Truog curve remains the clearest visual of why pH governs fertility. Each horizontal bar represents one nutrient’s relative availability across the scale, and the collective “sweet spot” where nearly every bar reaches maximum width is 6.0–7.0.
[IMAGE PLACEHOLDER: filename=”truog-nutrient-availability-curve-vector.svg” | ALT=”Truog Curve vector: bioavailability bars for N, P, K, Ca, S, Fe, Mn, Zn, Cu, B, Mo across soil pH 4.0–10.0, widest at 6.0–7.0″]
Macronutrients , nitrogen, phosphorus, potassium, calcium, magnesium, sulfur , peak near neutral. Phosphorus is the classic casualty: below 5.5 it binds with iron and aluminum; above 7.5 it binds with calcium, locking out in both directions [USDA Natural Resources Conservation Service (NRCS].
Micronutrients , iron, manganese, zinc, copper, boron , move the opposite way, staying soluble in acid ground and precipitating as pH climbs. Molybdenum is the exception, widening in availability as soils turn alkaline.
Read the curve’s failure modes symmetrically:
- Below pH 5.0: aluminum and manganese dissolve to phytotoxicity levels; root tips burn and stall.
- Above pH 7.5: iron-deficiency chlorosis appears even in iron-rich soil.
- Inside 6.0–7.0: bacterial nitrogen cycling and molybdenum-dependent processes run at full speed.
When deficiency symptoms appear despite adequate fertilization, the pH is usually the culprit , walk the nutrient lockout solutions protocol before buying more fertilizer, and check whether you can apply fertilizer and lime at the same time before stacking amendments.
Acid-Loving Plants and Vegetables: The Acidophile List
Every plants ph chart has a left column of acidophiles , species that evolved in acid forest soils and actively suffer in limed ground. Use this list of acid-loving plants to zone your beds so lime never drifts into their root zones:
- Blueberry , 4.5–5.5; the strictest acidophile in the edible garden (how to make soil acidic for blueberries).
- Cranberry , 4.0–5.5; commercial beds are maintained below 5.0.
- Azalea / Rhododendron , 4.5–6.0; classic ornamental indicator species.
- Potato , 4.8–6.5; acid ground suppresses common scab.
- Strawberry , 5.5–6.5.
- Raspberry , 5.5–6.5.
- Sweet Potato , 5.5–6.5.
- Watermelon , 5.5–6.5.
- Hydrangea (blue-flower) , 4.5–5.5; aluminum uptake drives color (aluminium sulphate for blue blooms).
- Camellia , 5.0–6.0.
The most common error we diagnose is liming an entire garden uniformly, then wondering why the blueberries chlorose. Acid loving plants and vegetables need sulfur-maintained beds, not the main garden’s amendment program; zone them separately and verify annually in that block alone.
Soil pH Levels Chart: Reading the Five Agronomic Bands
A complete soil pH levels chart reads the scale in five bands, each with predictable chemistry:
- Below 5.0 , Strongly acidic: aluminum/manganese phytotoxicity risk; bacterial activity suppressed; lime required for nearly all crops.
- 5.0–6.0 , Moderately acidic: ideal for acidophiles; phosphorus begins binding; moderate lime for vegetables.
- 6.0–7.0 , Slightly acidic to neutral: peak overlap of macro- and micronutrient availability; the target for most vegetables.
- 7.0–7.5 , Slightly alkaline: iron and zinc availability declines; acid-loving plants chlorose.
- Above 7.5 , Alkaline: phosphorus–calcium lockout, iron chlorosis, boron anomalies; elemental sulfur indicated , see how to lower soil pH fast without harming plants (and know your forms: elemental sulphur vs. sulphate sulfur).
Band placement also predicts biology: fungal-dominated activity tolerates acidity, while nitrogen-cycling bacteria slow sharply below 5.5. Bookmark this band logic beside any pH chart for soil you print, including our companion soil pH chart walkthrough.
Amendment Dosage Trigger Table: Lime & Sulfur by Texture
Generic lime recommendations fail because they ignore reserve acidity. Our Amendment Dosage Trigger Table cross-references three variables , starting pH, target pH, and texture , because cation exchange capacity scales with clay and organic content: more exchange sites, more stored hydrogen, more amendment needed to move the same decimal.
| Scenario | Starting → Target pH | Sand | Loam | Clay |
|---|---|---|---|---|
| Raise (ag lime) | 4.5 → 6.5 | 6–8 | 12–15 | 18–22 |
| Raise (ag lime) | 5.0 → 6.5 | 4–6 | 9–12 | 14–18 |
| Raise (ag lime) | 5.5 → 6.5 | 3–4 | 6–8 | 10–12 |
| Raise (ag lime) | 6.0 → 7.0 | 2–3 | 4–6 | 7–9 |
| Lower (elemental S) | 8.0 → 6.5 | 2–3 | 4–5 | 5–6 |
| Lower (elemental S) | 7.5 → 6.5 | 1–2 | 2–3 | 3–4 |
| Lower (elemental S) | 7.0 → 6.0 | 0.5–1 | 1–2 | 2–3 |
Execution rules we follow on every bed:
- Confirm with the buffer index. The table is a trigger, not a prescription; the lab buffer number sets the final dose , run it through the lime requirement calculator for exact rates.
- Split heavy lime rates into two applications a season apart when the trigger exceeds the loam mid-range, and time it with soil temperature using our best time for lime on lawn and garden guide.
- Incorporate into the top 6–8 inches. Surface broadcasting wastes months of reaction time.
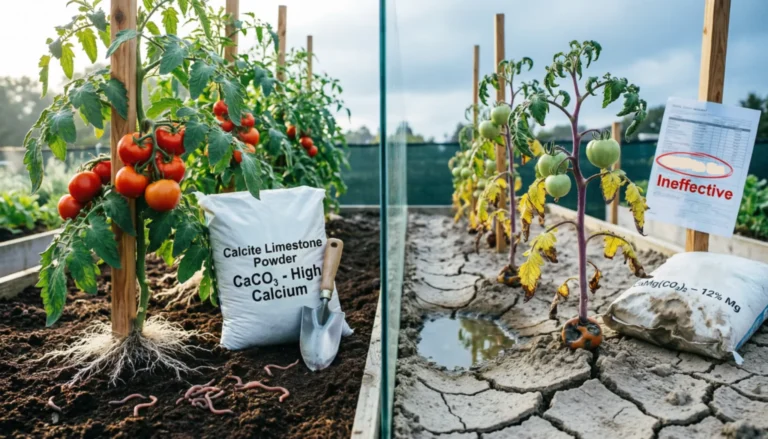
- Match the lime to your magnesium test. Choose dolomitic lime when magnesium reads low; choose calcitic lime when it is adequate , our calcitic vs. dolomitic limestone guide explains the tradeoff, and agricultural lime vs. pelletized lime covers format and true cost.
- Prefer elemental sulfur over aluminum sulfate when lowering pH to avoid salt-driven phytotoxicity; dose it precisely with the precision pH-down calculator.
- Retest after 8–12 weeks. Lime reacts slowly in cool ground , how calcium carbonate actually works explains why.
Counter-intuitively, sandy soils are the easiest to over-correct. With almost no soil buffering capacity, a round-number lime application can catapult a sand bed from 5.5 to 7.8 in one season, inducing manganese deficiency. Clay forgives overdoses; sand does not. If your long-term goal is improving cation exchange capacity rather than chasing pH decimals, start by measuring your baseline with the CEC calculator, then feed the exchange complex with compost first. For heavy ground, follow our sequence for amending clay beds before planting so lime and organic matter react in the same cycle , and size any gypsum work with the gypsum requirement calculator. Turf growers: follow the lawn liming blueprint for grass-specific types and rates.
How We Verify: Field Testing Protocol (Digital + Chemical + Lab)
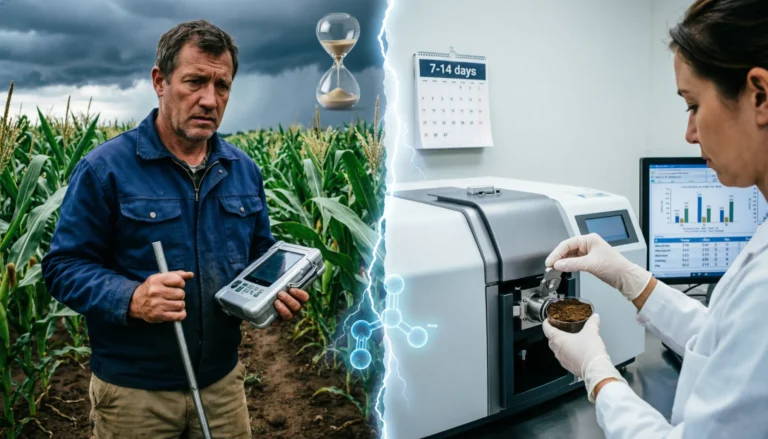
Charts are only as good as the number you feed them. Our field protocol runs three verification layers on every bed, every season.
- Digital meter: calibrate with pH 4.0 and 7.0 buffer solutions, test a 1:1 soil–water slurry, and rinse the probe between beds (and check our Borkut soil pH meter review before trusting a budget probe).
- Chemical dye kit: fast in-field triangulation for zone mapping between lab cycles , see how to test soil pH with strips to stop misreading the colors, and our LaMotte vs. Luster Leaf vs. Rapitest lab test before buying a kit.
- Professional lab: every 2–3 years for active pH, buffer pH, CEC, and exchangeable bases (what a professional soil test costs; convert those bases to percentages with the base saturation calculator).
The most common error we diagnose is testing bone-dry soil; moisture and CO₂ shifts can skew readings by 0.3–0.5 pH. Need a stopgap before your kit arrives? Some DIY hacks , yes, even testing soil pH with a pool kit , actually work. And when you log results, the ppm/EC calculator keeps salinity units straight. Test at consistent moisture, or skip the guesswork entirely with our full testing garden soil protocol.
Conclusion & Key Takeaways
- Most crops peak at pH 6.0–7.0, the band where the Truog Curve shows maximum combined nutrient bioavailability.
- Active pH tells you today’s chemistry; buffer pH sets your lime dose , never amend from one number alone.
- Texture multiplies dosage: clay holds reserve acidity and needs far more lime than sand, which over-corrects easily.
- Acidophiles belong in a dedicated zone so the main garden’s lime program never chloroses your blueberries.
Master these four rules and any pH chart for soil becomes a working document instead of wall art. Test, zone, dose by texture, and retest , your plants read the decimals whether you do or not.